
If you happen to be the go-to tech expert for your friends and family whenever their computers start acting up, you have probably opened the Windows Task Manager more times than you can count. It is the very first place most of us turn when a laptop begins to feel sluggish, a specific app stops responding, or the internal fans suddenly start screaming for no apparent reason. For decades, this tool has served as the built-in diagnostic dashboard for the Windows operating system, presenting colorful graphs for CPU, memory, disk, and GPU activity. These visuals often look authoritative enough to end any debate about what exactly is dragging down your system’s performance. However, there is a catch that most casual users never realize: those numbers are not always telling you the full story. While Task Manager isn’t intentionally trying to mislead you, it significantly simplifies and bundles very complex system behaviors into basic percentages and labels that are incredibly easy to misinterpret. Perhaps calling it a “lie” is a bit dramatic, but if you do not understand what these metrics actually represent, the data can feel intentionally deceptive. Once you pull back the curtain on what Task Manager is really measuring, those alarming spikes and confusing dips start to make a lot more sense in the context of modern computing.
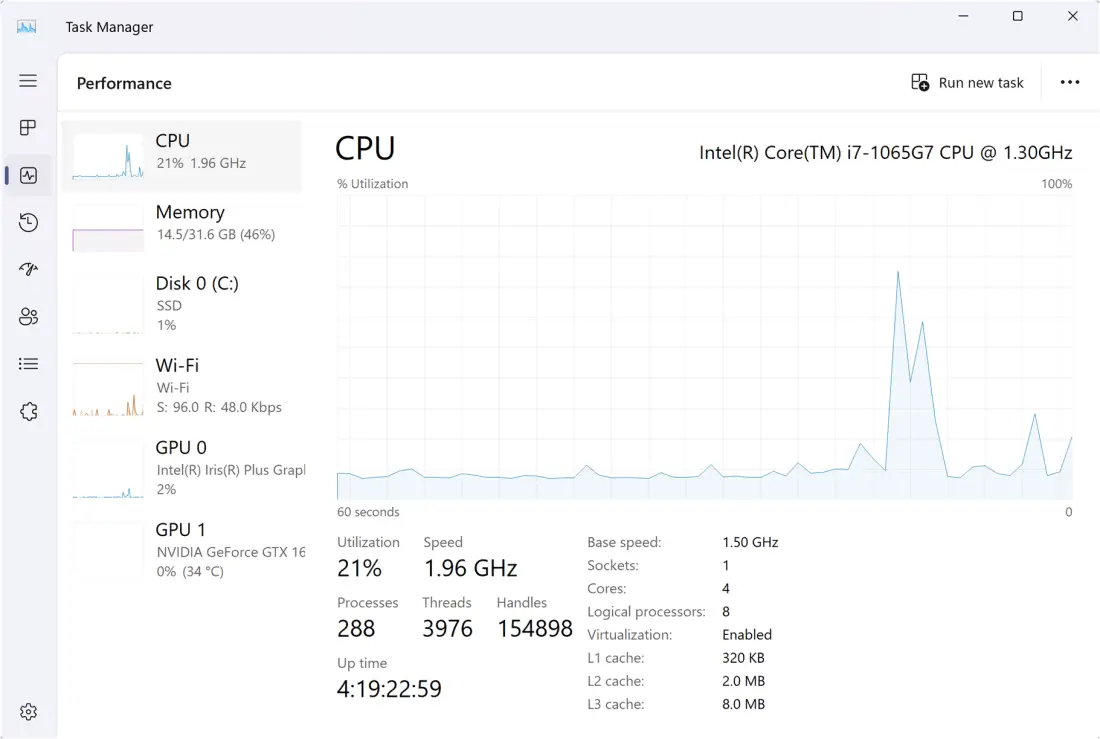
Take that CPU usage number, for example, which is perhaps the most looked-at metric in the entire utility. At first glance, the percentage seems straightforward; if Task Manager reports that your processor is sitting at 25%, most people naturally assume that the chip is only doing a quarter of the total work it is capable of handling. In reality, that percentage is nothing more than a blended snapshot of activity across every core and thread, averaged over a very tiny window of time. On a modern multi-core processor with 8 cores or 16 threads, it is entirely possible for a single intensive thread to be pushing one specific core to 100% capacity while the others sit almost entirely idle. Because Task Manager rolls all of that distinct data into one singular, overall number, it is very easy to miss a “bottleneck” scenario where one core is doing all the heavy lifting while the rest of the CPU looks relaxed. The way the Windows scheduler manages these workloads further complicates the visual data. The system is constantly shifting tasks between different cores to balance thermal output and energy efficiency. Background services are also frequently “waking up” to perform micro-tasks before falling back into a sleep state. Furthermore, CPU speeds are no longer static. Modern chips constantly bounce between base clock speeds and high-performance turbo frequencies based on current load, heat levels, and power limits. Task Manager tries its best to smooth all of this chaotic movement into a readable line graph, but what you are actually seeing is a volatile mix of short spikes and fluctuating clock speeds compressed into a simple, digestible percentage. It is helpful for catching massive, obvious glitches, but it lacks the precision required for deep technical analysis.
Read also: This Professional Design Secret That Costs Zero Dollars and Rivals Industry Giants
This trend of over-simplification continues when you look at the RAM usage bar, which is another area where Task Manager can look much more alarming than the situation actually warrants. When a user sees their RAM sitting at 80% or 90% capacity, the immediate instinctual reaction is to worry that the computer is about to crash or run out of memory entirely. In practice, a huge portion of that “used” memory is actually working for Windows in clever ways that do not stop other programs from functioning. Features like cached and standby memory are perfect examples of this. Windows is designed to keep recently used files and data sitting in your RAM so that they can be accessed instantly the next time you need them. If you suddenly launch a heavy application that requires more memory, the operating system can reclaim that cached space almost instantly, effectively clearing a path for the new task. Modern versions of Windows also employ advanced techniques like memory compression to pack more data into your physical RAM before the system has to rely on the much slower “page file” on your hard drive. Additionally, some of your memory is permanently reserved for hardware components, such as integrated graphics chips that “borrow” system RAM to function. Task Manager groups all of these varied categories into one basic usage bar, making it look like your system is choking when, in reality, it is just using its available resources as efficiently as possible.
Read also:Your Linux Desktop Just Got a Massive Power-Up: Everything New in KDE Plasma 6.6
Finally, we have the dreaded “100% disk usage” warning, which is a common sight that often looks far more catastrophic than it truly is. When that disk column turns bright red and hits the ceiling, it is easy to assume your drive is transferring data at its maximum theoretical speed and your system has hit a brick wall. However, that percentage does not actually measure raw data throughput. Instead, it is a measurement of how busy the drive is while responding to various requests. A drive can easily show 100% utilization even if it is only moving a tiny amount of data, provided it is struggling to keep up with a high volume of small, individual operations. This is a very frequent occurrence when Windows or a specific app is performing hundreds of tiny random reads and writes simultaneously. Each of these requests must be processed one by one, and the drive can end up with a massive backlog, known as an I/O queue. Slower drives, particularly older mechanical hard drives, hit this saturation point very quickly. From the perspective of the Task Manager, the disk is “fully utilized” because it is working as hard as it can to clear that queue, even though the actual megabytes-per-second transfer rate might be shockingly low. Understanding these nuances doesn’t make Task Manager useless, but it does mean we should look at its “authoritative” numbers with a bit more skepticism.
Read also:Stop Wasting Time: This Secret Open-Source App Is the Ultimate Procrastination Killer
Disclaimer: The information provided in this article has been collected from publicly available sources on the Internet. Readers are requested to verify this information with available sources.


